Back
4 Sep 2020
Gold Price Analysis: XAU/USD jumps 0.5%, breaching key descending trendline
- Gold's 0.5% rise has confirmed a breakout on the hourly chart.
- Key indicators suggest scope for further gains toward $1,950.
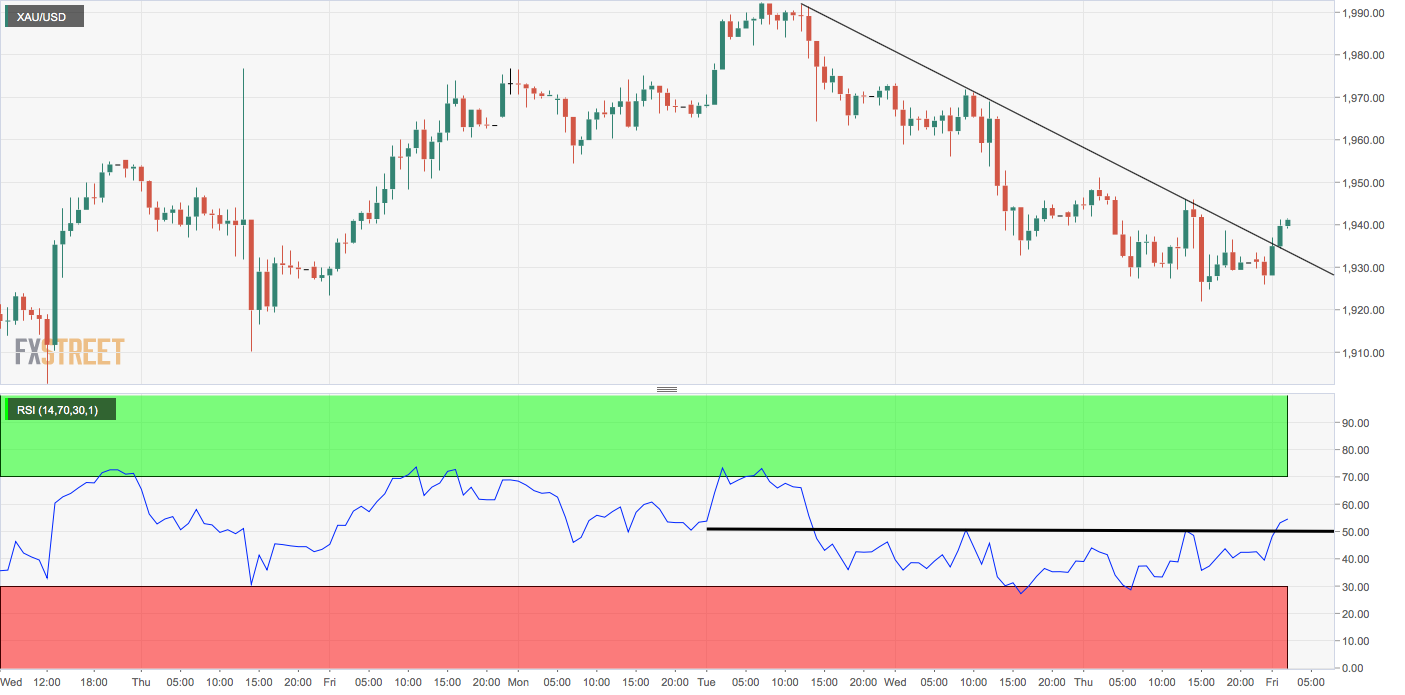
Gold is currently trading near $1,940 per ounce – up 0.5% on the day.
The metal has pierced the hourly chart descending trendline, indicating an end of the downtrend from the Sept. 1 high of $1,992.
An inverse head-and-shoulders breakout on the hourly chart accompanies the upside breach of the descending trendline. The hourly chart stochastic has also risen back into bullish territory above 50.00.
As such, one may expect prices to challenge resistance at $1950. On the downside, Thursday's low of $1,922 is the level to beat for the bears.
Daily chart
Trend: Bullish
Technical levels