Back
2 Mar 2020
GBP/USD Price Analysis: Pound pressuring 2020 lows below 1.2800 figure vs. US dollar
- GBP/USD is trading on the defensive below the 1.2800 figure.
- GBP/USD stays vulnerable to the downside.
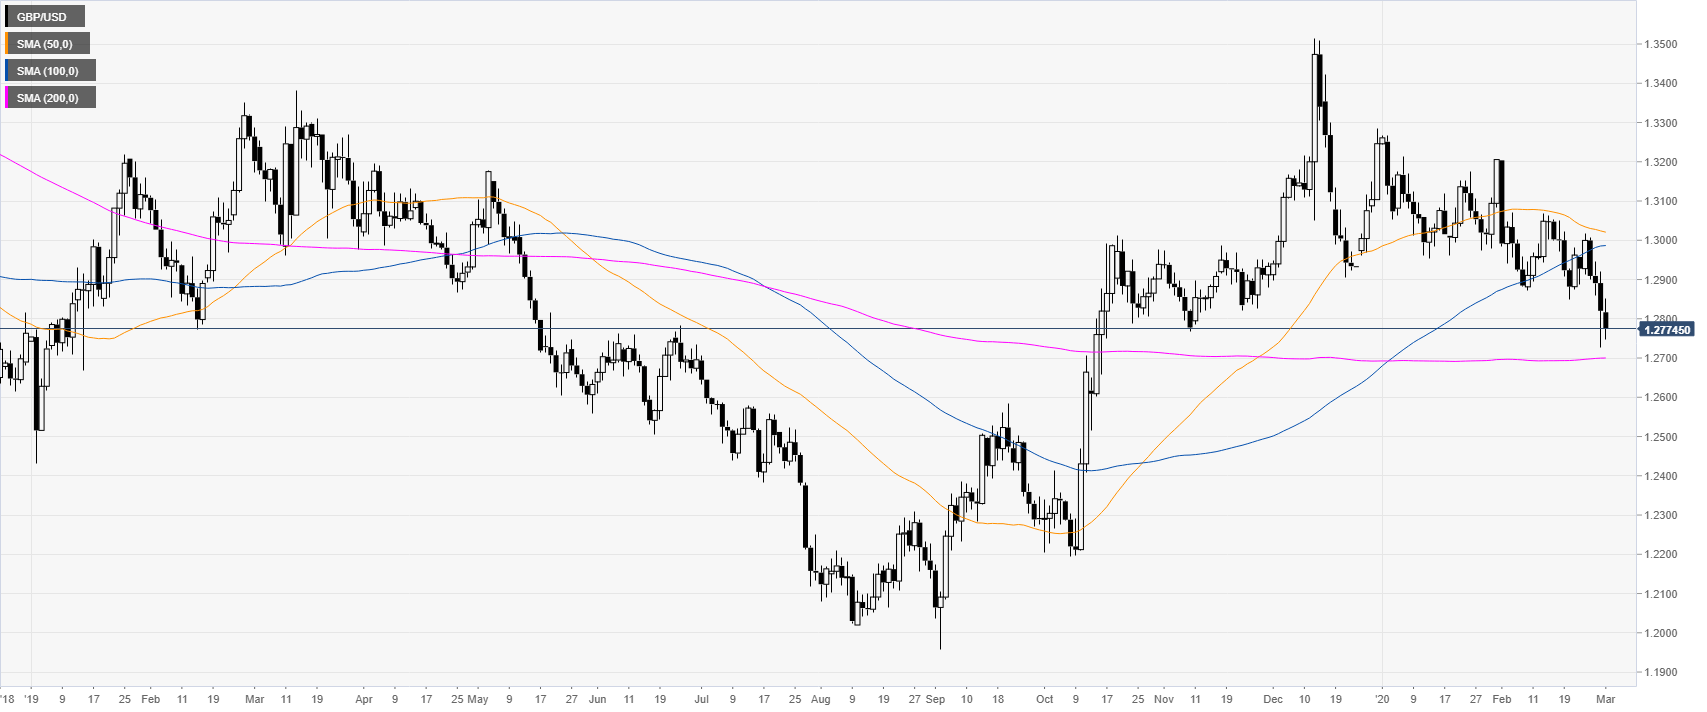
GBP/USD daily chart
GBP/USD is weakening below the 1.2800 figure and the 50/100-day simple moving averages (SMAs) as the spot is nearing 1.2700 and the 200 SMA.
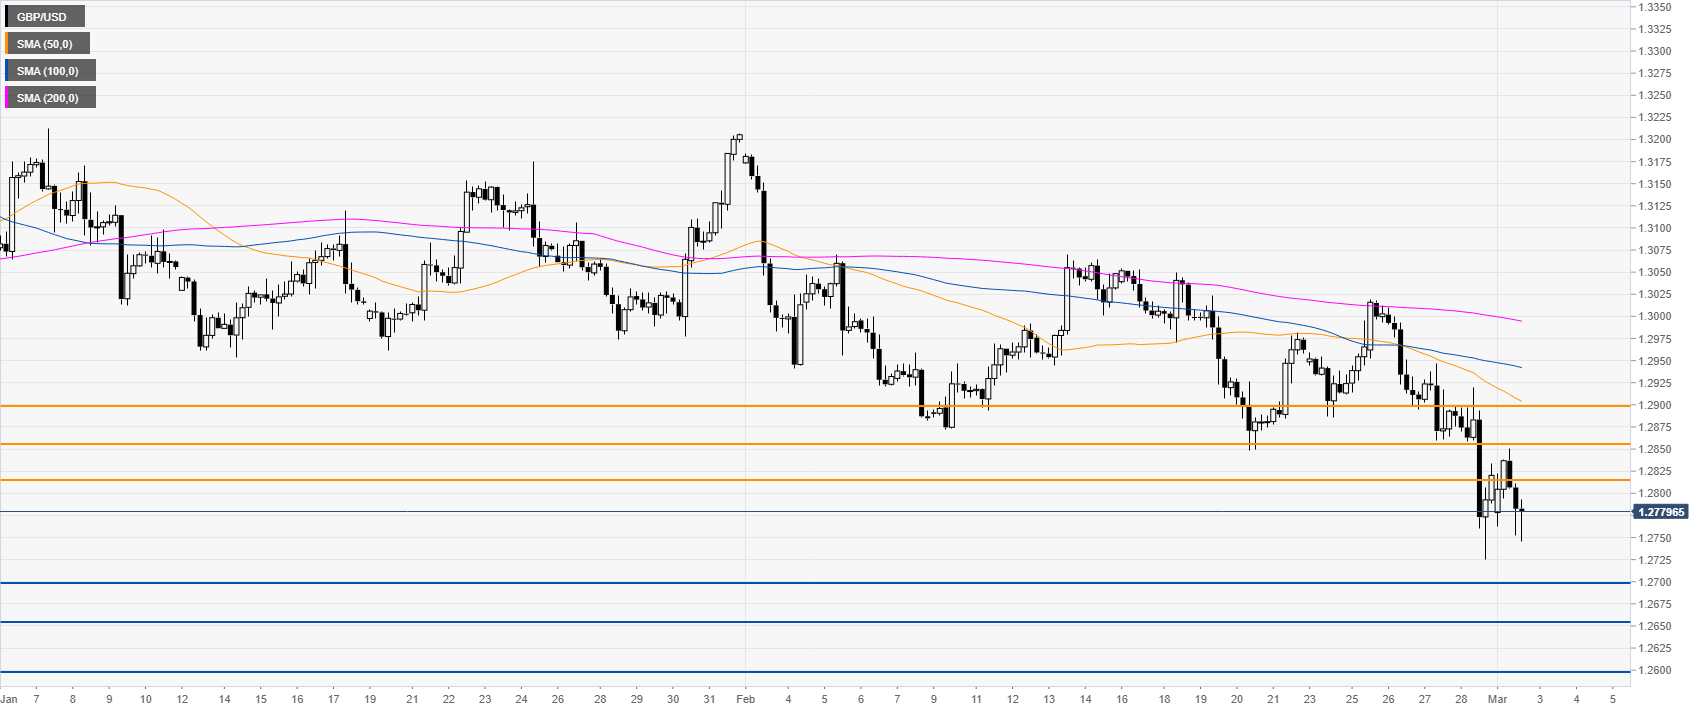
GBP/USD four-hour chart
Pound/Dollar remains under selling pressure below its main SMAs. The path of least resistance is to the downside with potential targets near the 1.2700, 1.2657 and 1.2600 levels. On the flip side, bullish runs could find resistance near the 1.2820, 1.2858 and 1.2900 levels, according to the Technical Confluences Indicator.
Resistance: 1.2820, 1.2858, 1.2900
Support: 1.2700, 1.2657, 1.2600
Additional key levels