Back
8 Jan 2020
GBP/USD Price Analysis: Pound bears targetting the 1.3000 handle
- GBP/USD is trapped in a triangle pattern.
- The level to beat for sellers is the 1.3100 support.
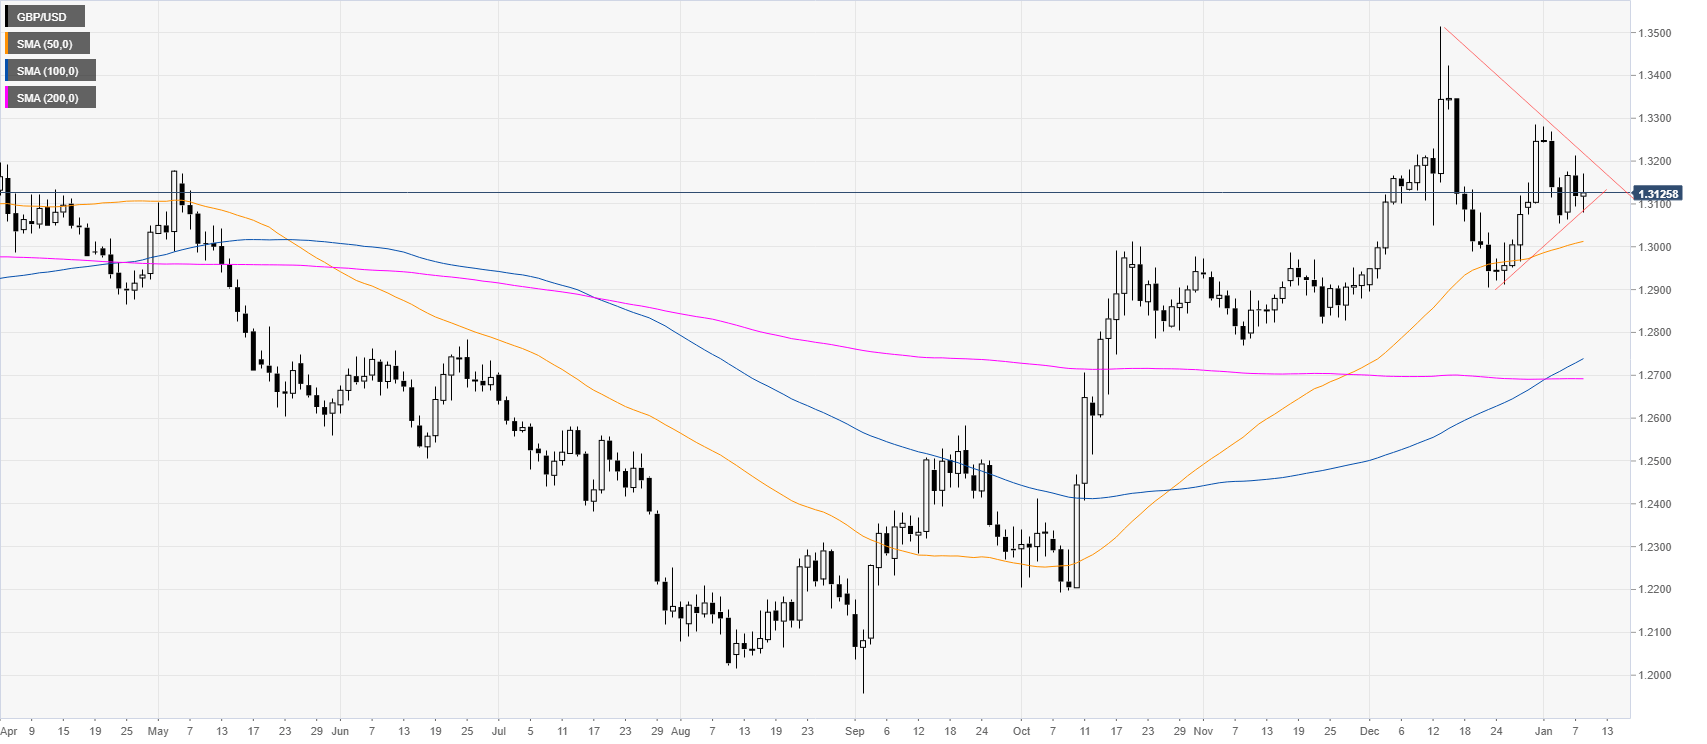
GBP/USD daily chart
GBP/USD is trading in a triangle pattern above the main daily simple moving averages (SMAs). The new trading year started with a potential lower high just below the 1.3300 handle.
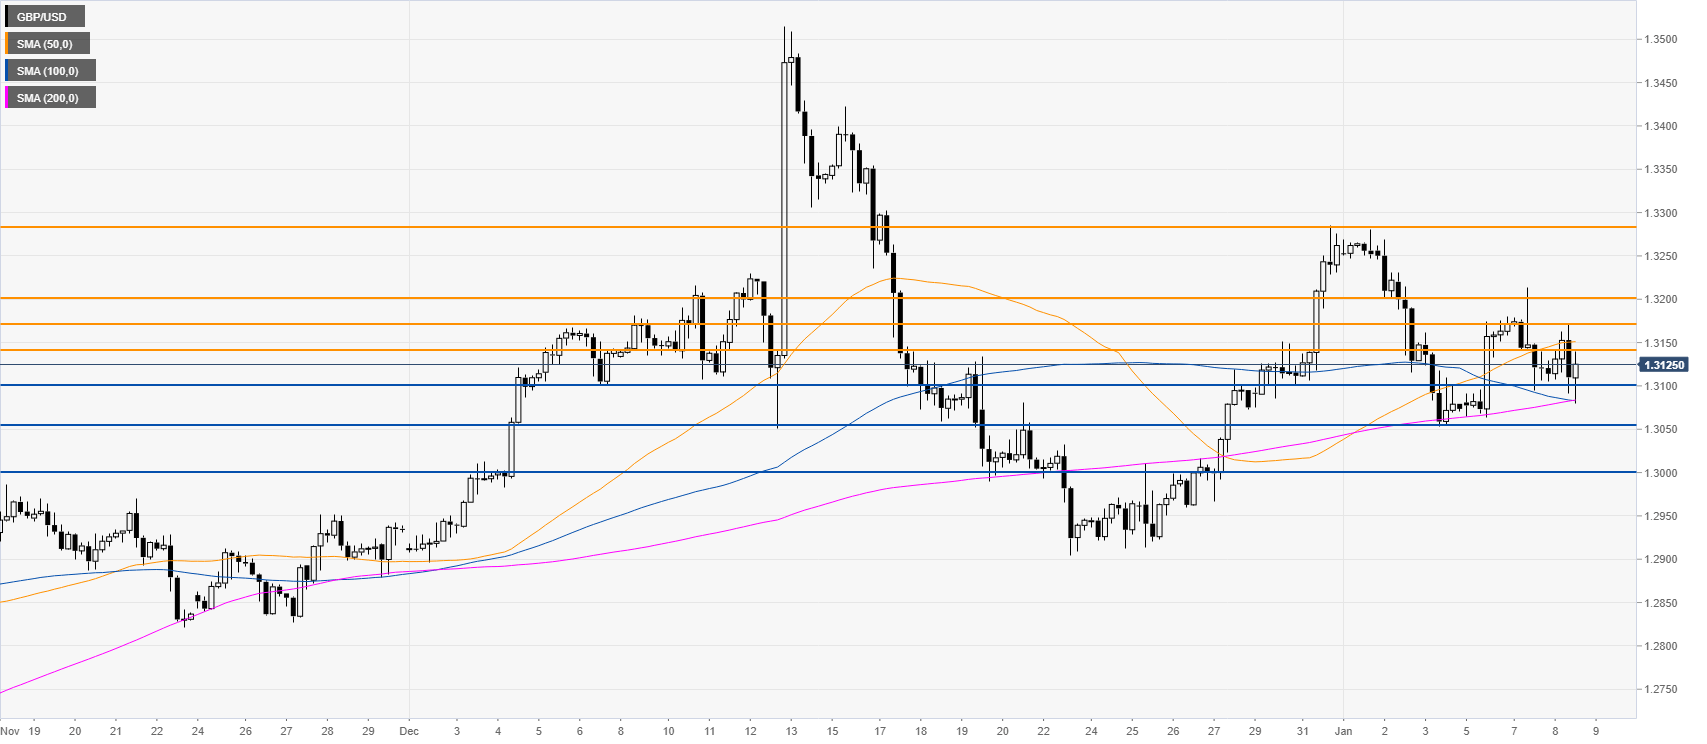
GBP/USD four-hour chart
The cable is displaying lack of bullish enthusiasm below the 1.3200 handle and the 50 SMA on the four-hour chart. If the bears breach the 1.3100 handle, the spot would probably decline toward 1.3055 and the 1.3000 levels. On the flip side, bulls would need to recapture the 1.3200 resistance on a daily basis to drive the quote towards the 1.3282 level, according to the Technical Confluences Indicator.
Additional key levels